|
|
|
|
|
|
False and Correct Audio Correlation Measurements
- About the difference between correlation meters and simple phase meters -
A while ago I implemented audio correlation measurements in several projects, e.g., in the Digital Audio Peak Level and Correlation Meter DPLCM-VFD. I cared about how to do that correctly and implemented it in a digital algorithm. This algorithm is not just trivial. Later I heard about a very simple method which obviously is implemented even in several professional audio devices. Hardly more than two simple comparators and one Exclusive Or should do. Could that be true? I doubted that.
This article is not meant to be a comprehensive introduction to correlation measurements. But some basic knowledge should be known so that I repeat it here.
In our case correlation means the similarity of two audio signals. These two signals can be:
The correlation is either expressed in % from -100% to +100% or as the correlation factor, which ranges from -1 to +1. Note that due to the correlation algorithm the level of both signals does not matter, i.e., it does not influence the measured result.
When a mono source is used for a stereo signal both stereo channels will be +100% correlated. When e.g. in a stereo signal both channels contain completely different signals, e.g. left (and only left) is the trumpet and right (and only right) is the guitar these stereo channels will be 0% correlated. With a third instrument appearing in both channels, the correlation will be somewhere between 0 and +100%.
Instead of explaining it mathematically I rather use a block diagram.
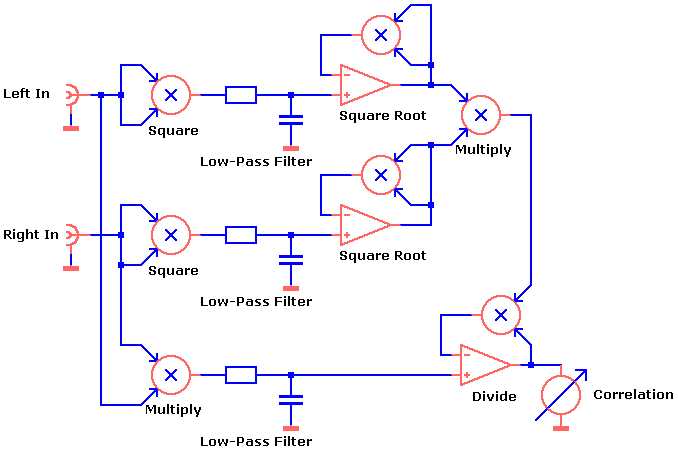
For this algorithm
This algorithm can be implemented as an analog circuit using 7 multipliers and a couple of op-amps. It can be implemented digitally, of course, too.
I put "simplified" in quotation marks, because it is not only simplified. Actually it is incorrect. Even though it seems to be used often.
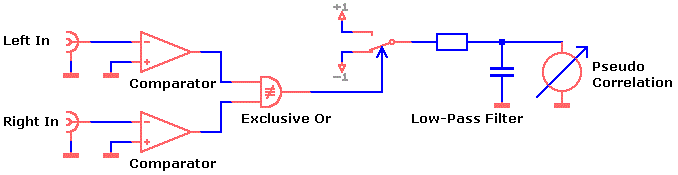
Only the signals' zero crossings are evaluated. I wouldn't say this algorithm is just easier to implement than the one above. Instead, I would rather say it is trivial. And thus cheap, of course. This algorithm does not describe a correlation meter, but only what can be called a phase meter.
Note that both algorithm diagrams are not complete for practice, because both are not prepared for very small or completely missing signals. In the correct algorithm there would a division by 0 error arise and in the "simplified" algorithm the XOR would constantly output -1 or +1, which is not correct. Indeed, there is neither a correlation nor a phase relationship if at least one of the two signals is 0.
When you compare both algorithms working with pure sine waves only they both show the same results. Both results do not depend on the signals' amplitudes and in both cases phase shifts of 0°, 90° and 180° result in correlation factors of +1, 0 and -1. So far there is no difference.
But when you use more complex signals like in the examples below, both results differ from each other:
Due to the fact that in these examples the zero crossings of both signals are the same, the "simplified" algorithm will result 100% correlation even though both signals are obviously not fully correlated.
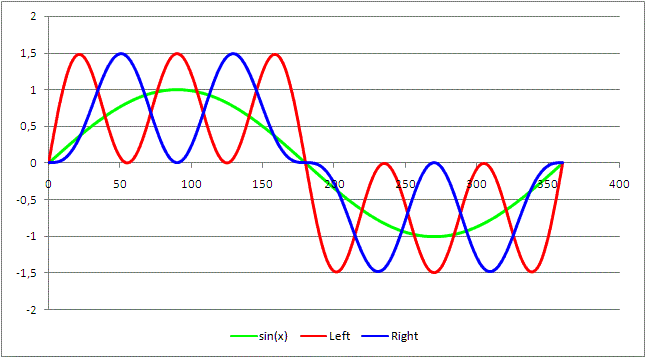
The red and the blue signal is evaluated for the correlation
result. Both signals are the sum of a sine wave and its 3rd
and 5th harmonic. The difference between both signals
is that in the blue signal the sum of the 3rd and 5th
harmonic seems to be phase reversed (it is not perfectly phase
reversed). To be precise,
the red signal is y = sin(x) + 0.35 * sin(3 * x )+ 0.91 * sin(5
* x) and the
the blue signal is y = sin(x) + 0.5 * sin(3 * x) - 0.5 * sin(5
* x)
The actual correlation of the signal pairs above is approx. 42%. Compared to this correct result, the "simplified" algorithm's result of 100% is a simple catastrophe.
In another experiment I tried the third harmonic only:
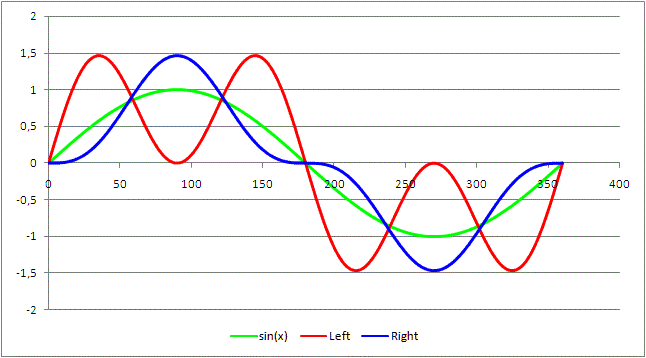
In this case
the red signal is y = sin(x) + sin(3 * x) and the
the blue signal is y = sin(x) - sin(3 * x) / 3.
And in this case the actual correlation of the signal pairs is approx. 44%.
By the way, the correlation between the red and the green signal above is 70.7% while it is 95% between the blue and the green signal.
Admittedly, these examples are extreme cases. In practice the errors will be significantly less but still the "simplified" results will be more or less rough estimations only. For professional equipment such rough estimations are totally unacceptable. People would kill you there for much less.
| Last update: October 30th, 2021 | Questions? Suggestions? Email Me! | Uwe Beis |