|
|
|
|
|
|
Introduction
Feature Overview
Features in Detail
Color Filters
Some Sample Display Screenshots
Available to buy or as DIY-project?
This VFD- (Vacuum Fluorescent Display-) based device is a successor to the LED-based DPLCM I designed a while ago. I happened to get some graphical VFDs with features so perfectly fitting to the needs for a DPLCM and, moreover, looking so fascinating (even when it is not working) that at first I could not withstand to make the VFD run and afterwards to transfer the DPLCM to the VFD to improve the DPLCM's functionality more and more. Like its predecessor this DPLCM is also working with an FPGA only, there is no microprocessor or DSP in the design.
This DPLCM is designed to monitor nothing but digital audio streams. In order to monitor analog audio signals a significantly different approach ought to be taken.
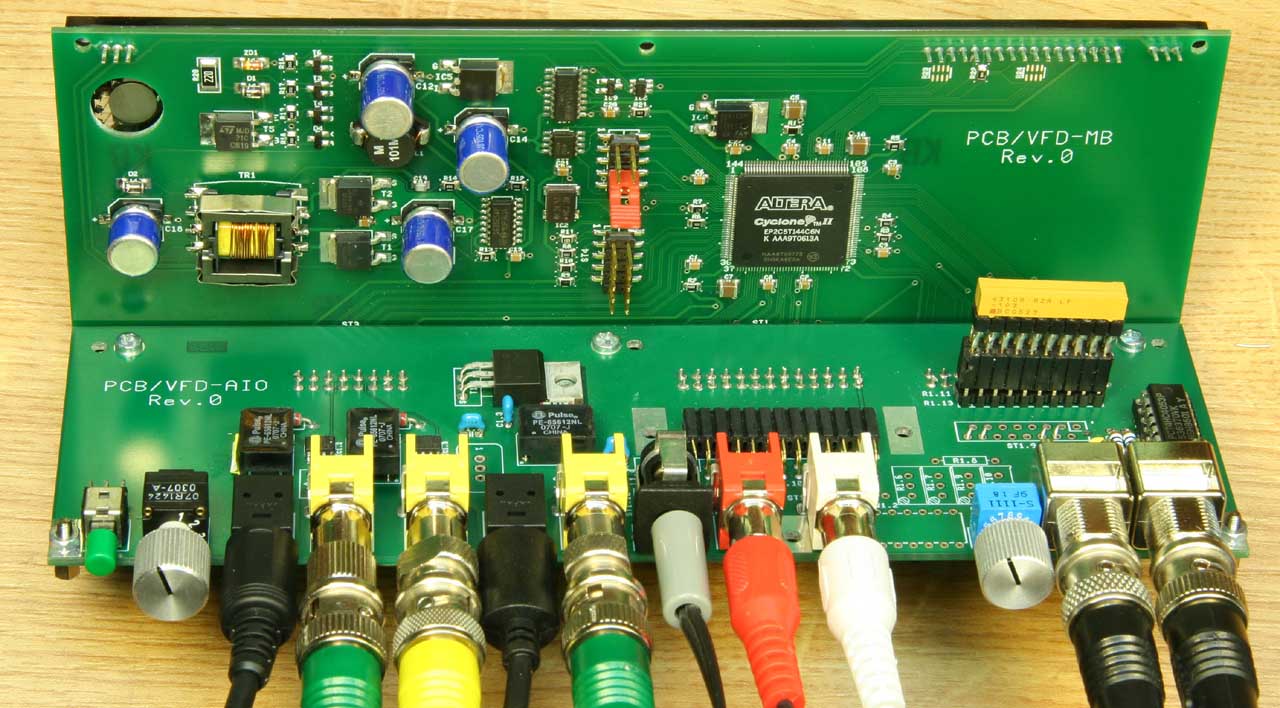
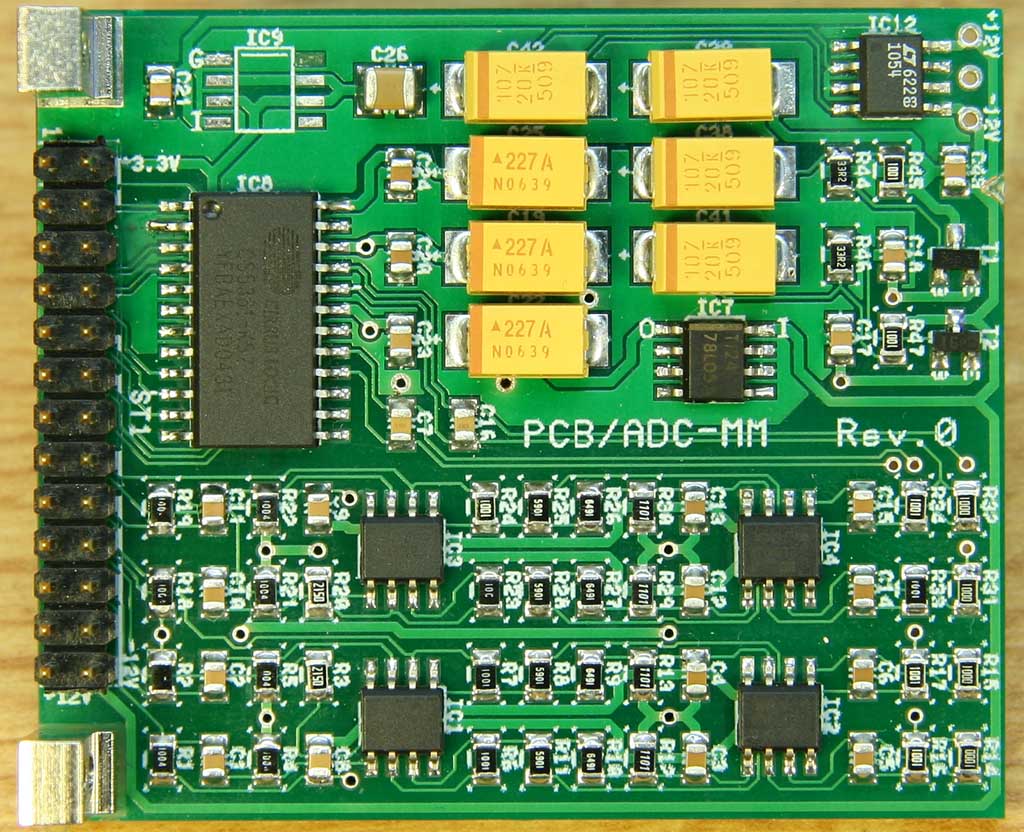
The upright board behind the VFD is a general purpose board for the VFD. It contains the VFD supply and security circuitry, the FPGA to control the VFD and a number of digital I/Os. The horizontal board contains all components to adapt the VFD module to a digital audio environment, like optical in- and outputs, isolated coax in- and outputs with balanced line receivers, a slot for an ADC-module, switches, the power supply jack and two BNC jacks with R2R-DACs for test purposes.
 Feature
Overview
Feature
OverviewThe VFD is a Noritake MN25664P, a graphical display in CIG- (Chip-In-Glass-) technique. All column and grid decoders and drivers are within the VFD glass so that in contrast to usual graphical VF-displays there are few external connections only. This display is able to display 15 different luminance levels + black. 2 different luminance levels (+ black) are used in this design.
The display refresh rate is as high as 150 Hz. It is important that VFDs, in contrast to LC-displays, virtually do not have any response time.
The attack time of this DPLCM is one sample only (virtually zero). This is the only sensible behaviour when digital audio streams shall be monitored. This DPLCM is not designed to monitor analog audio signals: For analog audio signals usually PPMs (Peak Program Meters) are used. The most common specification for peak program meters is the German DIN specification 45406. Rather than to respond instantaneously to peak this specification requires a finite “integration time” so that only peaks high and wide enough to be audible are displayed. In contrast to that goal the DPLCM is designed to display exactly the headroom until clipping because in digital audio signals clipping, no matter of its duration or amount, cannot be tolerated and, on the other hand, any signal amplitude below clipping is perfectly acceptable.
The specified return time of 1.5s to -20 dB according to DIN 45406 requires a 650 ms decay time constant. This specification is also adopted for the DPLCM.
The bar display consists of 200 segments for each channel. These many segments allow an exceptionally high display range, not only sufficient for sound but also for very low-noise noise measurements which are required e.g. for checking the studio equipment.
Note: 24 Bit signals exhibit a minimum peak level of -137 dB approx., 16 bit signals -89 dB approx. (except zero, of course).
The scale is non-linear: Between -4 and 0 dB FS the resolution is the highest:
| Range (dB FS) | No. of Segments | Resolution (dB) |
| 0 to -4 | 40 | 0.1 |
| -4 to -12 | 40 | 0.2 |
| -12 to -32 | 40 | 0.5 |
| -32 to -112 | 80 | 1.0 |
Each display bar can be divided into up to three individual bars: Peak Level, Peak Hold and RMS Level (see below). The Peak Hold function can be switched off (no Peak Hold bar) or timed for 0.5, 1 or 2 seconds or infinite, resettable by a pushbutton.
The Peak Hold function is equiped whith a "Soft Drop" function: When the hold time is expired the Peak Hold bar slowly, with increasing speed, starts to drop. Though this process is so fast that it is hardly visible it helps a lot to make the Peak Hold function more comprehensible.
 Peak
Level Display Numerical
Peak
Level Display NumericalThe level hold by the Peak Hold function is also displayed numerically. Between 0 and -99.9 dB FS the display resolution is 0.1 dB, below it is 1 dB. The full theoretical dynamic range of a 24 bit signal of 137 dB can be displayed numerically.
Additionally and simultaneously to the Peak Level and the Peak Hold measurement RMS (Root Mean Square) measurements can be made. If enabled, the measured RMS values are displayed by the third (lowest) part of the display bar.
RMS values represent the average energy contents of a signal. With a perfect square wave signal RMS- and peak level values are the same, in all other cases the RMS value is lower. For a sine wave signal it is 3.01 dB lower (1/2 power) and for avarage music it is 10 dB (1/10 power) or thereabout less. The peak value / RMS value ratio is called the "Crest Factor".
Quite sketchy: The correlation measurement is a helpful means to determine how much two signals (left and right audio signal) resemble each other. The correlation between two identical signals is +100% and between two sine waves signals with 180° phase rotation -100%. The correlation between two completely independent signals is 0.
Correlation does not depend on the individual signals' amplitudes. I.e., no matter how much one of the signals is attenuated or amplified, the correlation of both signals reamins the same.
Sometimes correlation measurements are used to determine the "mono-compatibility" of stereo signals. When portions of both stereo channels are in phase opposition they will unwantedly cancel each other when joined to mono. The correlation for these kinds of stereo signals is typically rather low or even negative. Mono-compatible stereo signals are supposed to correlate at least 50% or so. But whether conclusions can be drawn from the measured correlation to the mono-compatibility also depends very much on the recording situation: Particularly in configurations with spacially separated microphones the correlation may be low while the mono-compatibility is not reduced. (Technically: In this case we have harmless and mono-compatible independent sources rather than unwanted and mono-incompatible phase opposition portions in the stereo signal.)
The sample rate of the actual digital audio signal is displayed numerically up 200 kHz with 100 Hz resolution.
The number of active bits (or the "width") of the actual digital audio signal is displayed numerically. In all S/P-DIF signals always 24 bits per channel are transmitted but not all of them are necessarily active. In order to determine how many bits are active the individual bits of the audio signal are monitored and if a certain amount of LSBits (Least Significant Bits) for a certain time remain zero they are regarded to be inactive.
CD- or DAT-signals e.g. are 16 bit wide, studio signals usually use all available 24 bits. Though they are very unlikely to occur, all other number of active bits can be displayed, too.
The DPLCM is equipped with 4 inputs:
A selector switch for these 4 inputs is located on the rear and the selected input is indicated on the display.
The selected input signal is output as well on an isolated coax (RCA) jack as on an optical Toslink transmitter. Provisions for a 3rd output, e.g. an AES-3 XLR-jack, are made.
 Audio
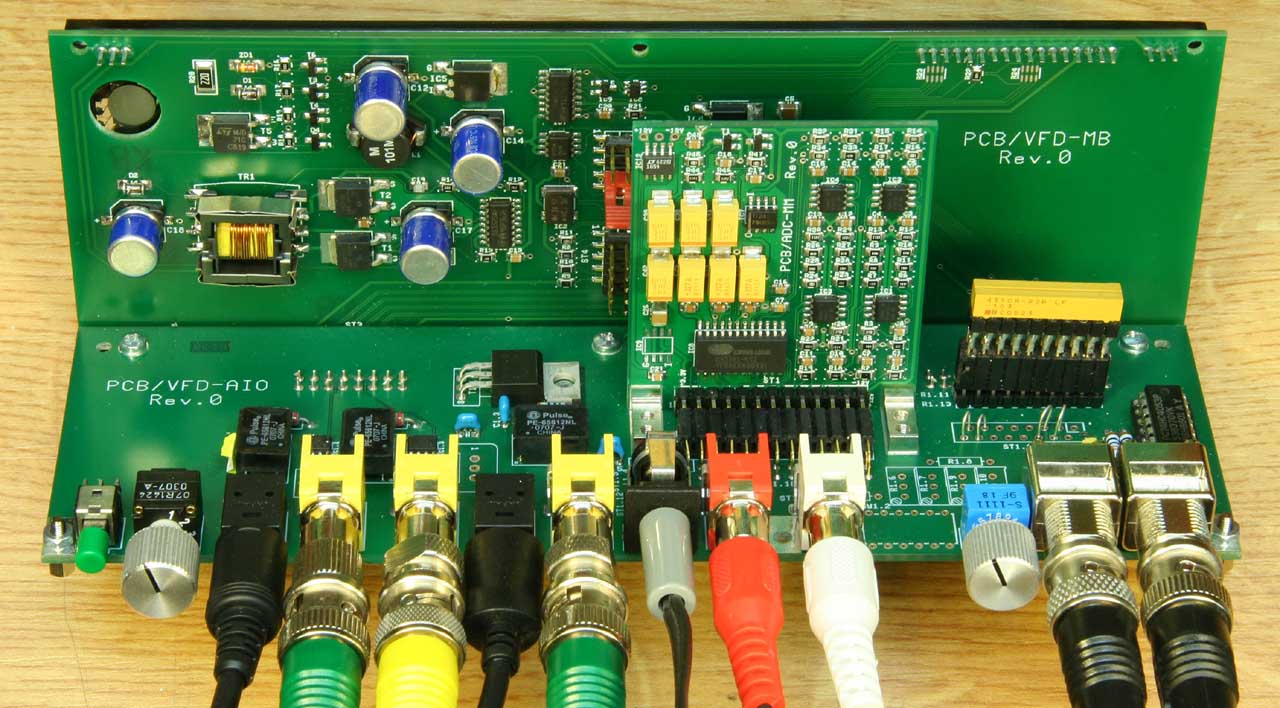
ADC 48/96/192 kHz with S/P-DIF Output
Audio
ADC 48/96/192 kHz with S/P-DIF OutputThe optional ADC module is equipped with a 110 dB Cirrus CS5361 and is more or less identical to the preamplifier and ADC-section of the AD24QS. The sample rate can be set to 48, 96 or 192 kHz. It allows to measure analog signals within a dynamic range of up to more than 100 dB or up to 90 kHz bandwidth, both dependent on the sample rate setting. The analog audio signals, like the digital ones, are displayed as peak levels (bar and numerical display) and RMS values (bar and numerical display).
When the ADC input is selected, these signals on both digital audio outputs are available as S/P-DIF signals (professional digital audio format) so that the DPLCM can be used as an audio ADC, too.
The VFD's phosphor color is blue-green and when externally illuminated, the VFD's contrast is not reduced too much. The color is very much equal to the color of modern oscilloscope tubes while the VFD's contrast is better. Even though it can be improved by color filters. The photo below shows 4 filters as examples. These filters are 3 mm thick acrylic glass plates, called "Plexiglas®" from the German company Röhm.
(Click for an enlarged view)
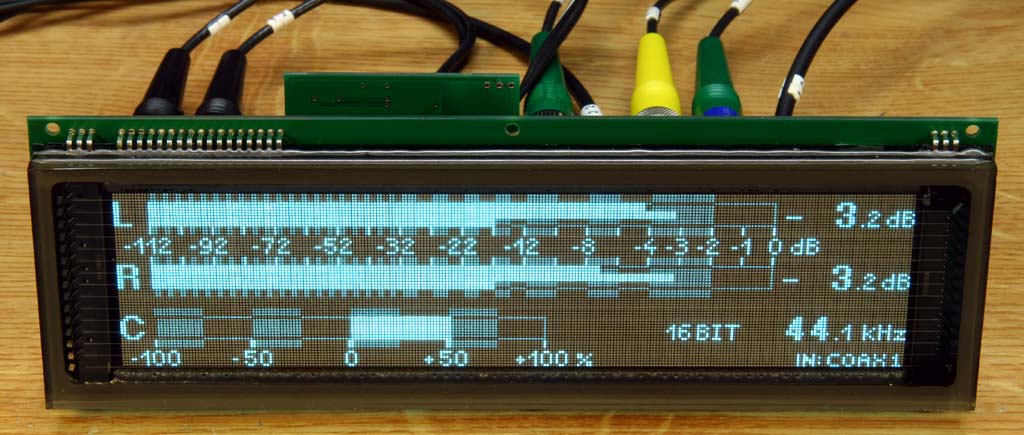
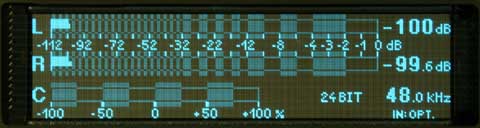
From left to right:
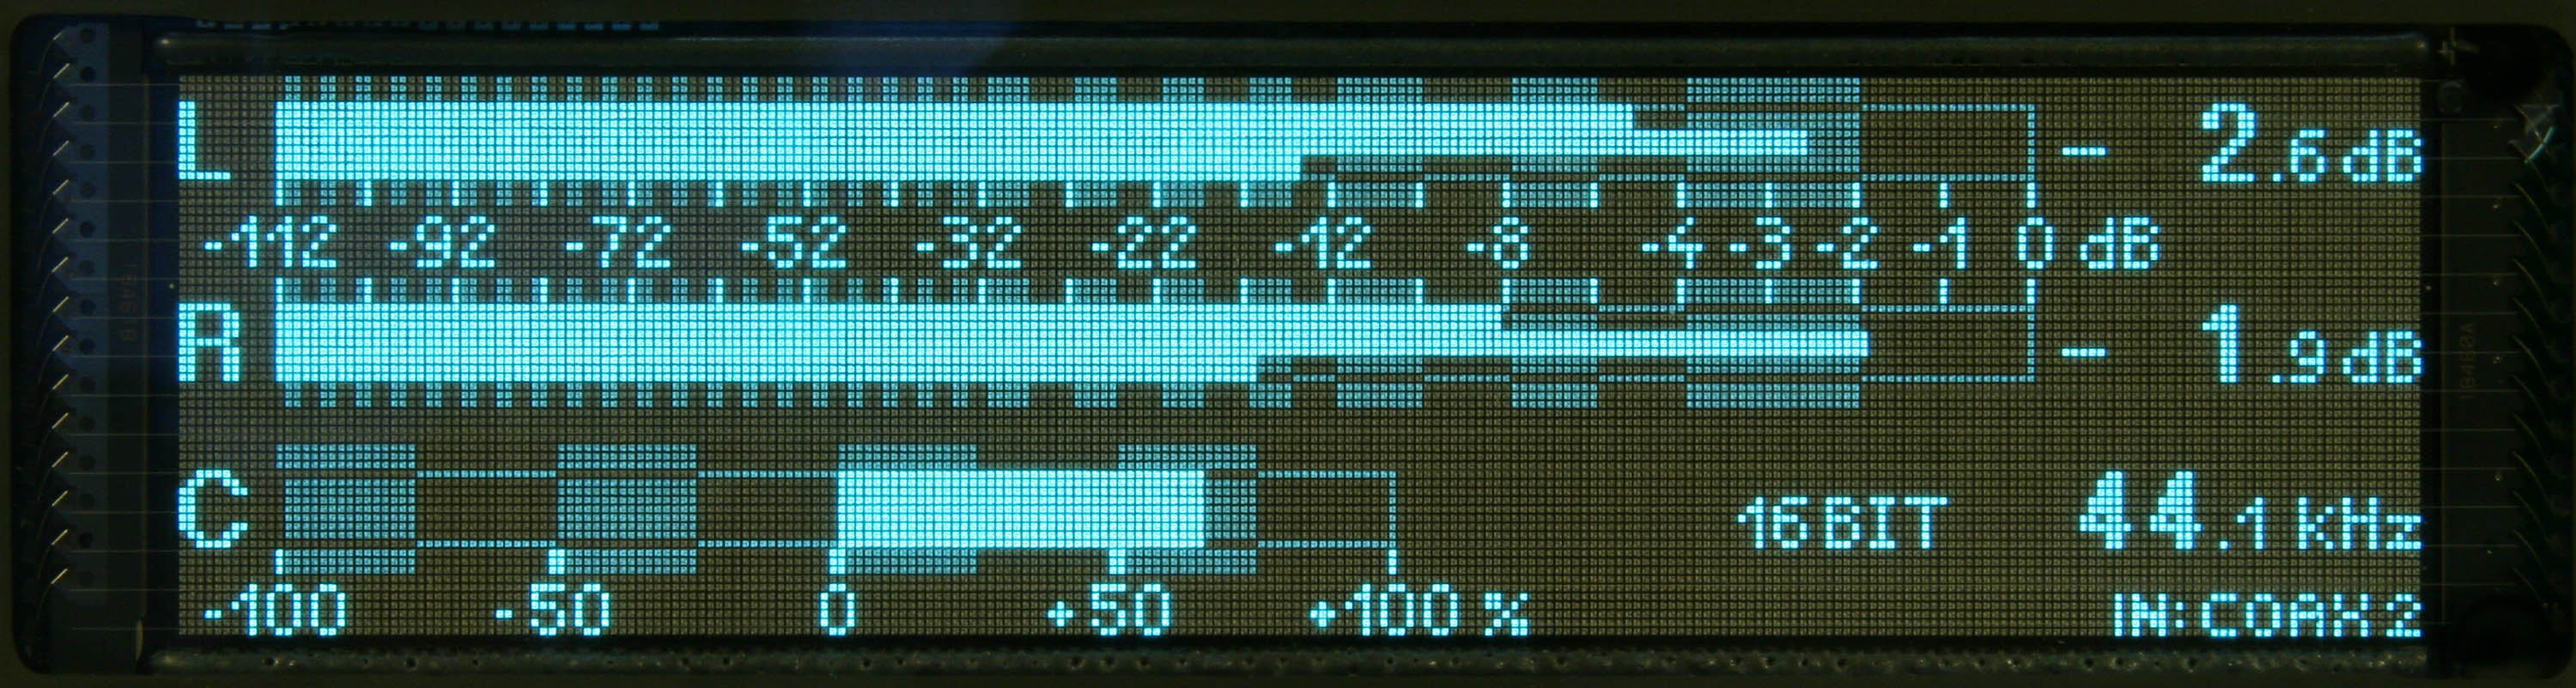
A "typical" display, with numerical peak hold display
and RMS bar-display. The 16 bit, 44.1 kHz input comes from
input "Coax 2".
Click to enlarge
to a very detailed (3000 pixel, 500 kByte) view.
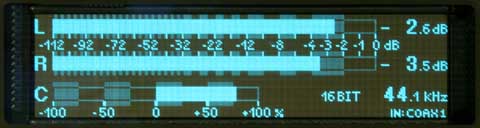
The simple display without peak hold and/or RMS display. The 16
bit, 44.1 kHz input comes from input "Coax 1".
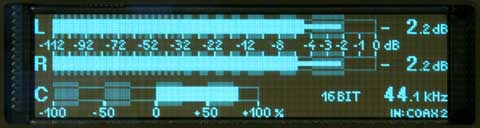
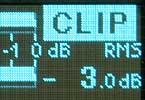
This display additionally shows the peak hold bars. The 16 bit,
44.1 kHz input comes from input "Coax 2".
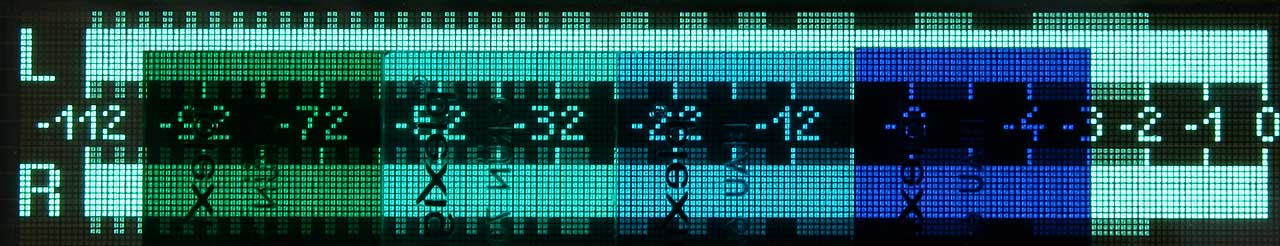
Here an external ADC (AD24QS)
is connected to the optical input. The ADC has no input signal,
so only its input noise is measured. Peak values are displayed,
and the peak noise level is 100 dB below the maximum peak
level.
Because of the fact that the correlation of both signals is zero one can recognize that the measured noise is pure random noise from the ADC. If there was externally injected noise it would influence both channels likewise and the correlation would be positive.
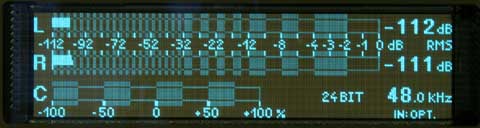
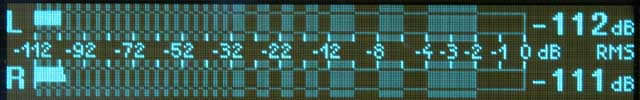
This is the same ADC source as above, but the numerical display
shows RMS instead of peak values. While -111 dB just fits
on the bar's scale, -112 dB does not (-112 dB is actually
rounded up, so its real value may be up to 1 dB less).
Note: Because a 100% FS sine wave signal reads out -3.01 dB, the actual SNR in this case is only 109 or 108 dB resp.. This measurement is not, as usual, weighted or limited to a bandwith of 20 kHz (the actual bandwidth is 24 kHz). Limiting the bandwidth to 20 kHz would reduce the noise level by another 1.6 dB (i.e., keeping the rounding in mind, to -111 and -110 dB), so that this measurement perfectly meets the technical data I published for the AD24QS.
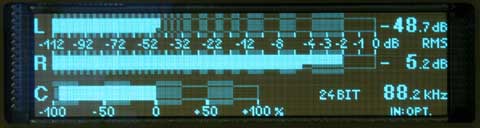
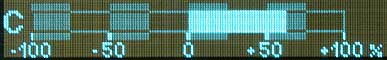
Finally a measurement with two signals of 180° phase rotation
and a large level difference. The correlation is -95% approx..
If the signal source for this measurement was perfect, -100% correlation
could be read out.
I am not prepared to produce more of these devices than my prototype, thus I am not prepared to sell it.
For DIY this design will be too complex. For several reasons I don't intend to prepare documention for DIY. From the experience with the LED-DPLCM I know that there are too few people both, interested in and informed about the existence of this project. Particularly for such few people much too much work would have to be done - I know that from the experiences with my ADC- and DAC-kits.
Should anybody even though be interested in getting such a device, I'd have to assemble it myself, handcrafted, singly, all parts bought in lowest quantities. I wouldn't want to do this as part of my hobby, I would want to sell the little spare time I have "decently". In other words: It would become really expensive. (But compared to the amount of work to design the hard- and software this still would be ridiculously cheap...)
Yes, I'm afraid, this project will disappear in the drawer.
| Last update: October 13th, 2015 | Questions? Suggestions? Email Me! | Uwe Beis |