| |
|
Highly Accurate Reference Frequency from DCF77
- An experimental setup, no DCF77-DO, but precise determination of e.g. OCXO frequencies -
(![]() Deutsche Version: Hochgenaue Referenzfrequenz aus DCF77)
Deutsche Version: Hochgenaue Referenzfrequenz aus DCF77)
| |
|
Highly Accurate Reference Frequency from DCF77
- An experimental setup, no DCF77-DO, but precise determination of e.g. OCXO frequencies -
(![]() Deutsche Version: Hochgenaue Referenzfrequenz aus DCF77)
Deutsche Version: Hochgenaue Referenzfrequenz aus DCF77)
This is not a recommended method to realize a very accurate reference frequency e.g. for calibration purposes. There are professional, affordable, better solutions for this, and DCF77 is only suitable for generating "moderately good" reference frequencies. I later read in other reports that this is the case. But not why and to what extent this is the case.
This is an experience report that has gradually developed. The work on it then somehow became what we call a "self-runner". But the findings and results are, in my opinion, interesting and worth describing.
Detailed information about DCF77 can be found in the report Zeit- und Normalfrequenzverbreitung mit DCF77 (Time and normal frequency dissemination with DCF77) from PTB Braunschweig. There is also a lot of background information there that explains my observations and experiences. Unfortunately, I only discovered it late. As I said, it started out as a simple experiment, without great ambitions or high goals.
This is how it all began:
During the development of the AD2-XS, its voltage-controlled crystal oscillator (VCXO) was to be set as precisely as possible to the target frequency. In other words, about as good as good crystal oscillators are specified with a maximum of approx. ±10 ppm. The measuring device should therefore be much more accurate. My frequency counter, an HM8021-3, has a perfectly adequate 8 digits, which corresponds to a resolution of 0.01 ppm for frequencies that start with "999...". Even a frequency of 10 MHz can be displayed with the overflow LED + 8 zeros with a resolution of exactly 0.01 ppm or 0.1 Hz. 0.01 ppm corresponds to 10-8. However, my frequency counter with its TCXO (temperature-compensated crystal oscillator) was much less accurate and had not been calibrated for a long time due to the lack of a frequency standard.
Because I already had a DCF77 receiver with 77.5 kHz output, but the frequency was displayed very unstable, I thought, then make a 10 MHz VCXO with PLL, which is synchronized by the 77.5 kHz. (Only later did I get to know the term "DO" = Disciplined Oscillator). That worked, the results were sufficient, but they were not really reliable.
And so it went on:
Was the reason for different measurement results the TCXO or the DCF77-DO? Now the "self-runner" started. There were inexpensive used OCXOs of an older design for sale. So I converted the HM8021-3 to OCXO. I compared the frequency of the DCF77-DO on the oscilloscope with a second OCXO whose frequency can be adjusted with a control voltage (so they are actually VC-OCXOs) and was amazed at the strong phase changes of the DCF77-DO, which of course caused its frequency to change significantly at times. As a high-quality DCF77-DO, my setup can hardly be used, and as it turned out in the course of time, for other reasons too.
In order to investigate the background more closely, I then set up the OCXO with a phase comparator on the breadboard and compared it with the DCF77-DO. It made sense not to use the 10 MHz directly, but to divide both frequencies by e.g. 16 beforehand. I was now able to observe and record the phase changes over a longer period of time, but a breadboard setup is far too unreliable for this. In order to observe the frequency of the DCF77-DO over a longer period of time, the OCXO frequency must be set extremely accurately. You only need to hit the breadboard once and then it is adjusted again. And it's far too fiddly with a trimmer anyway.
So I designed a printed circuit board and built this OCXO/divider/comparator circuit twice to test the reliability. As I said, it was a self-runner. So here are the results. A tabular overview of the observed frequency deviations can be found at the end of the article.
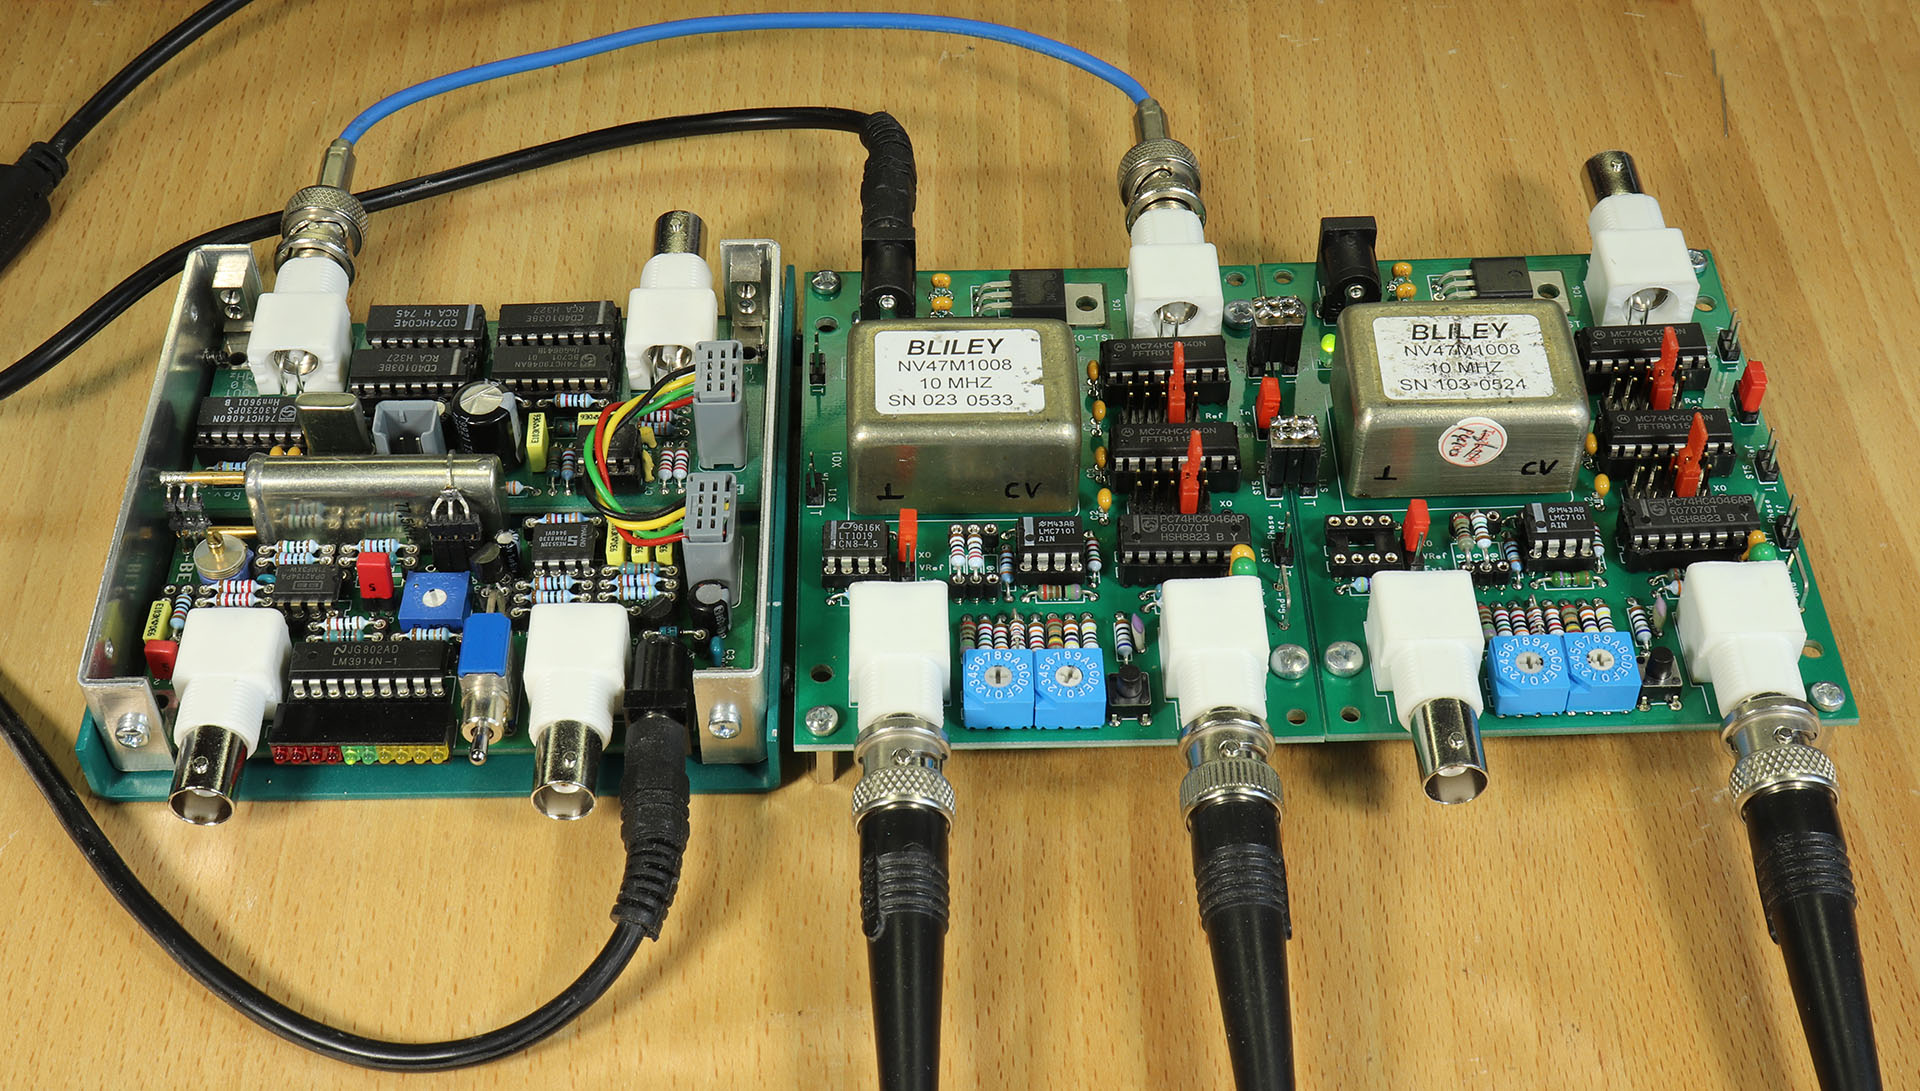
Image: View of the complete system.
Left: The DCF77-DO with the DCF77 receiver in the front area and the PLL circuit behind it.
Right: The two OCXOs with phase comparator.
With one DCF77-DO and two OCXOs, there are therefore 3 10 MHz sources.
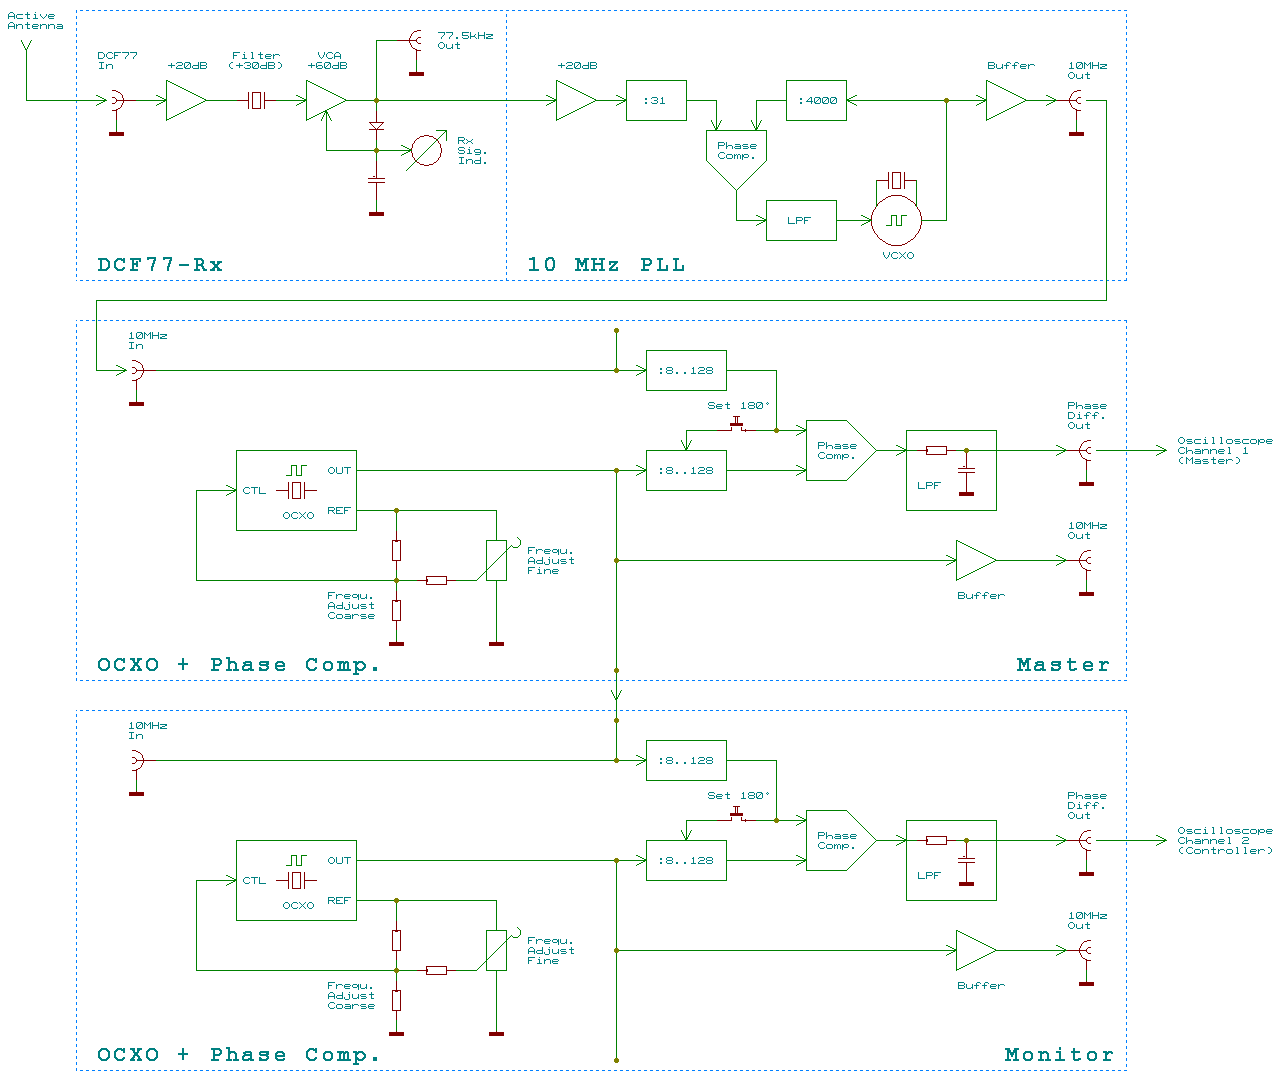
The first OCXO+phase comparator, I call it the "Master OCXO", compares the 10 MHz frequency output by the DCF77-DO with its own. If its frequency is greater than the 10 MHz derived from the DCF77 signal, the phase difference signal increases.
The second OCXO+phase comparator, I call it the "Monitor OCXO", compares the frequency of 10 MHz output by the master OCXO with its own. If its frequency is higher than that of the master OCXO, the phase difference signal increases.
As I said, there are 2 OCXOs. This means that I can prove that both OCXOs operate without interference and with negligible phase fluctuations or frequency jumps.
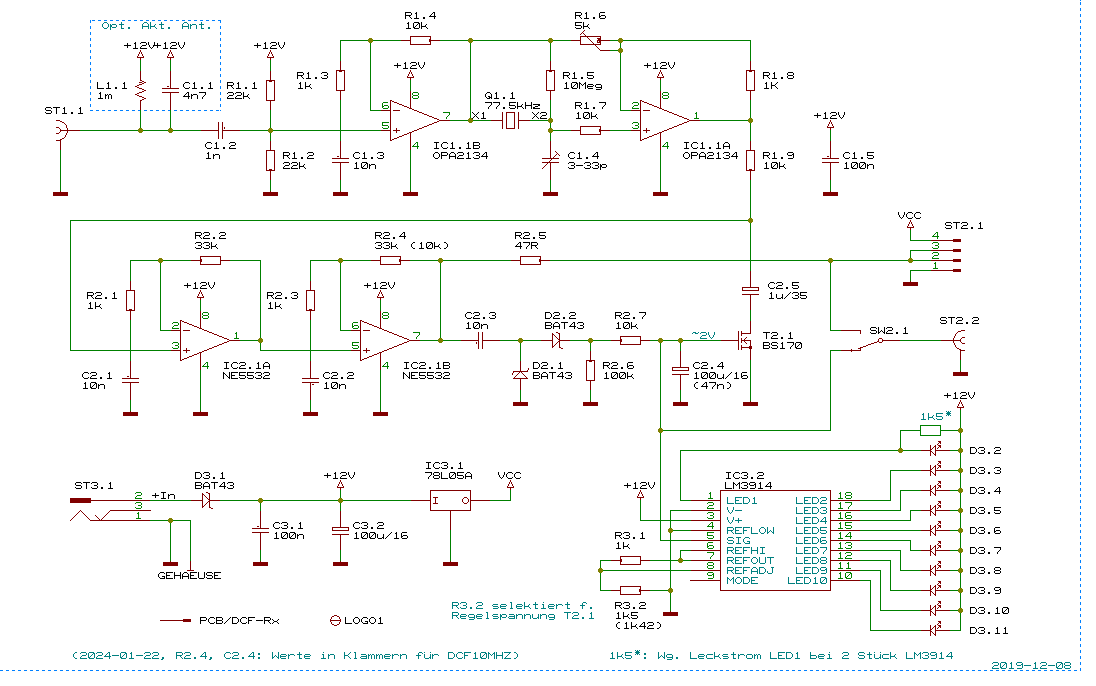
The circuit is conventional. The signal from the active antenna, which is supplied via L1.1, is amplified by 20 dB and fed to the filter crystal.
This is connected in such a way that at resonance the voltage at C1.4 or the input of the following amplifier stage is considerably higher than at the output of the previous stage. As far as I remember, this is approximately a factor of 30, or 30 dB. For this application, the crystal filters with a maximum narrow bandwidth. There is a slight parasitic coupling directly from the output of IC1.1B to the positive input IC1.1A, via which other spectral components can get past the filter crystal. They can be largely compensated for with R1.6.
This is followed by amplification of a further 60 dB and amplitude control. An output voltage display should literally show whether "everything is in the green zone".
Both the operating voltage and the 77.5 kHz signal can be transferred to the PLL (or another circuit) via ST2.1.
The 77.5 kHz signal is amplified again and divided by 31 to 2.5 kHz as a rectangular signal. 2.5 kHz is the largest common divider of 77.5 kHz and 10 MHz.
The 10 MHz from the VCXO is divided by 4000 to 2.5 kHz and fed to the precision phase comparator of the 74HCT9046. I have described why I use a 74HCT9046 and not the usual 74HCT4046 in the article Exact and faulty phase comparators.
The control time constant is relatively large. It takes about half a minute for the PLL to lock, but, as we will see later, this is far too fast to at least determine the short phase fluctuations of the received signal.
Together with the DCF77 receiver, the 10 MHz PLL produces a DCF77-DO, but not a good one.
I would expect an improvement if I prevented the phase comparison during and shortly after the second marks. In addition, the time constant of the loop was increased considerably after these tests (R15 = 47 kΩ, R16 = 220 kΩ), but this only resulted in a small improvement. Significantly more could only be achieved with a much, much larger time constant. However, in order to engage faster, this should contain a circuit that has a small time constant with a large phase difference.
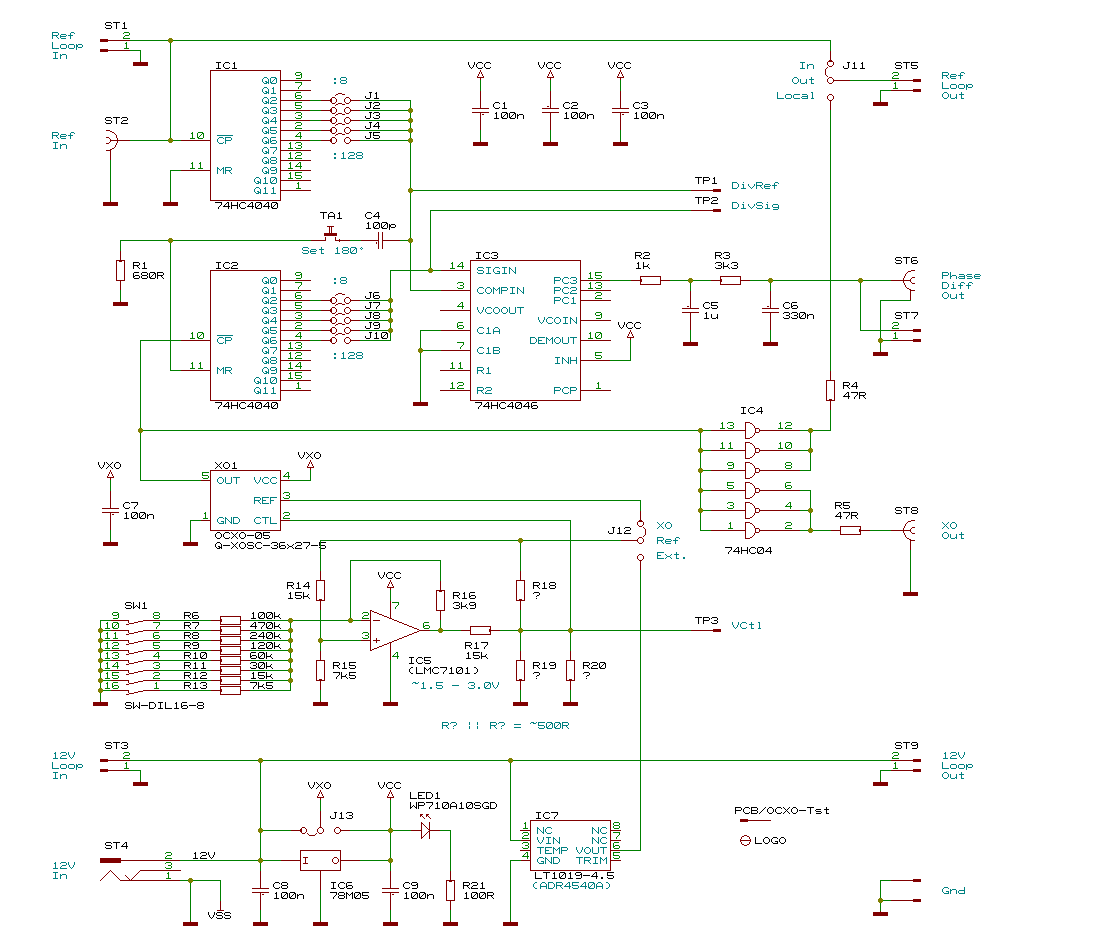 There are used OCXOs that are operated with 5 or 12 V. I have 5 V versions here. The frequency setting via the CTL input must be made in extremely small steps. Here I have provided a range of 50 mV in 256 steps of 200 µV each. The coarse adjustment of the range must be carried out experimentally using resistors R18 and R19 with fine adjustment using R20. An external reference (IC7) or the internal reference can be used as a voltage reference. I have only ever used the internal reference.
Both the external 10 MHz and the 10 MHz of the OCXO can be divided by 8, 16, ... 128. For the tests documented here, I divided the 10 MHz exclusively by 16 to 625 kHz. The PC3 of a 74HC4046 can be used as a phase comparator to generate a PWM signal from 0 to 100%, which is proportional to the phase shift from 0 to 360°. The following low-pass filter produces a voltage of 0 V to VCC (= 5 V) at the phase difference output. With one exception: If the phase difference is less than approx. ±15 ns, the PCP3 output toggles at half the input frequency. This results in 2.5 V at the phase difference output of the low-pass filter and is clearly visible on the lower, "blue" measurement curves when there is a phase change (0° ↔ 360°).
With both OCXOs, the frequencies drift of course, and differently, they are never exactly correct. But I can determine very precisely how large the actual frequencies are at the moment by comparing them with the DCF77 signal if the reception conditions are right.
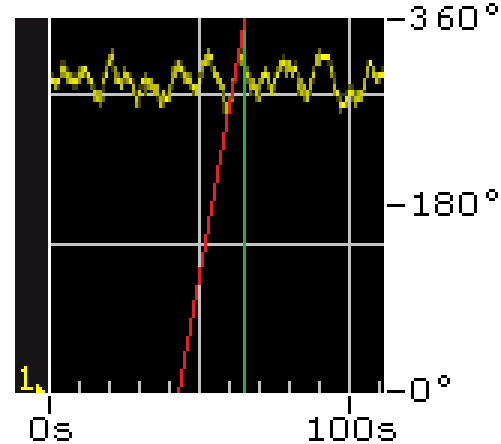
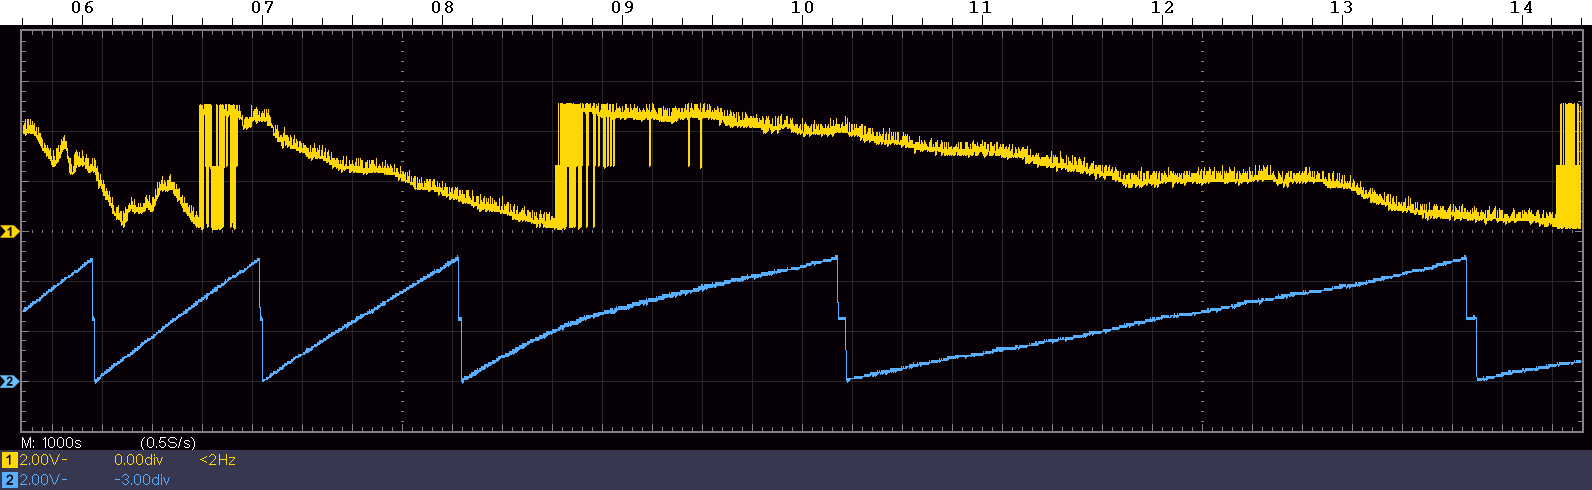
In the following oscillograms I have shown the two phase difference signals of the phase comparators. 5 V, i.e. 2.5 scale divisions, correspond to 16 10 MHz cycles = 1.6 µs. First the short-term behavior, a sequence of 600 seconds:
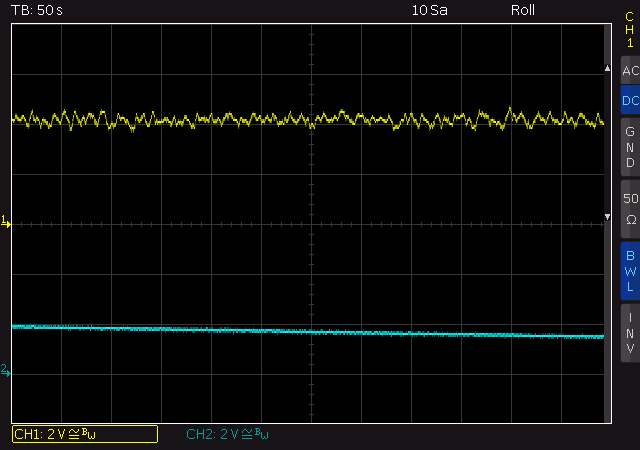
This screenshot was taken when the frequency of the master OCXO averaged over a long period of time corresponded very precisely to that of DCF77 (channel 1, yellow). Relatively strong phase fluctuations can be seen here.
The phase difference between the master and monitor OCXOs (channel 2, blue) is not as constant over a long period of time, but there are no phase fluctuations..
The aim is to determine a frequency precisely. However, the phase is measured or displayed, or more precisely: the phase difference of two signals over time. How can we deduce the frequency from the phase, what does the oscillogram above mean in terms of frequency?
Mathematically speaking, the frequency is the derivative of the phase or the phase is the integral of the frequency. If the frequency is constant, the phase increases continuously at a constant rate.
The phase φ is usually specified as an angle in degrees (°). 360° results in a revolution, a cycle or a sinusoidal oscillation - whatever is currently present. Simplified, the frequency f in Hz results from the phase φ with the time t in seconds:
f = φ/(360°*t)
or the difference between the frequencies of two signals from the difference between their two phases:
Δf = Δφ/(360°*t)
Here I do not specify the phase angle φ, but only the number n of whole cycles (n = φ/360°). Then the frequency f simply follows:
f = n/t bzw. Δf = Δn/t
 This means for the oscillogram above:
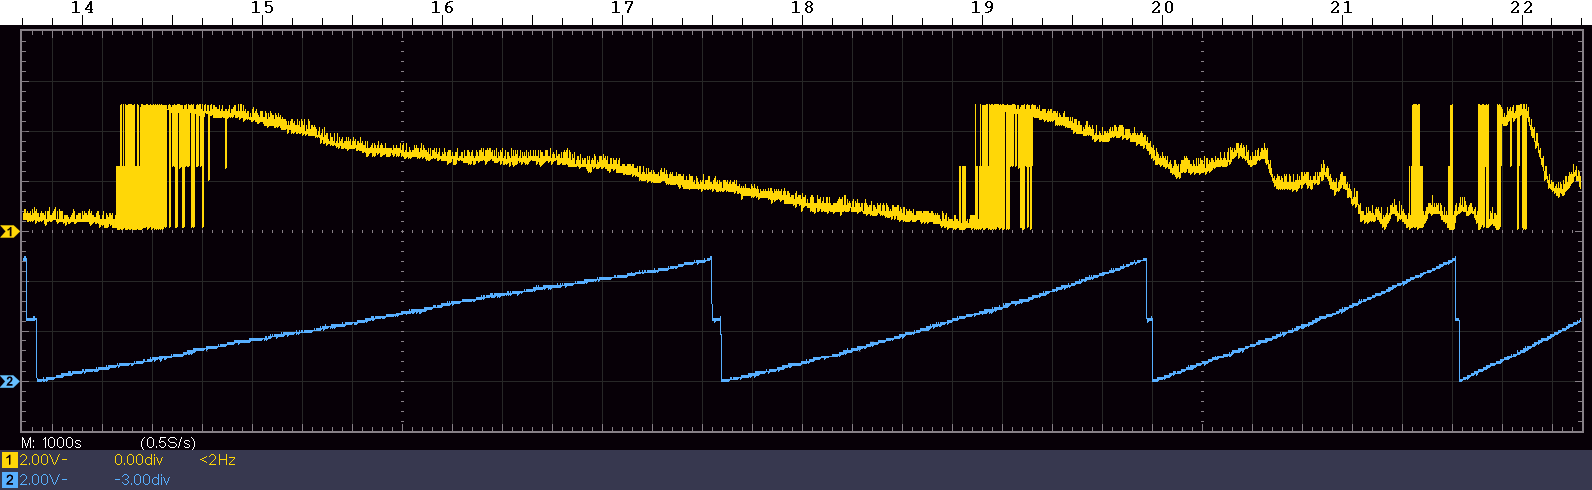
A section of the oscillogram on the right: The phase difference between the master OCXO and the DCF77 signal (channel 1, yellow) changes at a rate of approx. 16 cycles per 23 seconds at the point under investigation.
Δn = 16
t = 23s
Δf = 16/23s = ~0.7 Hz
During this phase change, which lasts approx. 5 seconds, the frequency is therefore not 10.000 000 MHz, but approx. 0.7 Hz (corresponding to 0.07 ppm = 70*10-9) higher.
Let's take the phase comparison between master OCXOs and monitor OCXOs (blue channel) from the screenshot over 600 seconds: Approx. 5/16 V voltage drop (corresponds to n = 1 cycle) within 450 s results in 1/450 Hz = 2.2 mHz or 0.00022 ppm = 0.22 ppb (= 220*10-12).
The difference between the DCF77 frequency or phase and that of the master OCXO (yellow channel) is not related to the instantaneous values, but much better on average. I dare say that the deviation is far less than the 100 ns in the previous comparison with the monitor OCXO.
As you can already see, the deviation of the frequency of a signal from the DCF77 standard can only be determined with really high accuracy if the DCF77 signal is constant over a very long time. And this is not often possible:
The short-term phase fluctuations of the DCF77 signal described above are very noticeable. The peak amplitudes in the oscillogram are approx. 0.4 V, which corresponds to approx. 460° at 16*360° per 5 V. This is related to 10 MHz and corresponds to approx. 3.6° at 77.5 kHz. These phase fluctuations are always present, even at this magnitude. I don't know where they come from. I think I can reject two theories:
1. the DCF77 signal is phase modulated. This pseudo-random phase modulation is ±13°, but is repeated exactly identically every second and can therefore be ruled out.
2. a phase shift during the second pulses can be clearly recognized on the phase comparator of the 10 MHz PLL. It is considerably larger than the 3.5° visible here and, depending on whether it is a 0 or a 1 blanking, undoubtedly also affects the frequency of the VCXO. On average, several zeros in succession must inevitably lead to a different phase position than several ones in succession. But: Because the data telegram no longer changes or changes very rarely from about the 25th second onwards, identical structures should be recognizable in the phase fluctuations for about 30 seconds every 60 seconds. However, this is not the case at all.
Reception of the DCF77 signal is not often as reliable for as long as would be necessary for high accuracy. The following effects interfere:
Due to the short-term fluctuations of the DCF77 phase, it is necessary to average or measure over a very long time. The longer, the better. Meanwhile, the quality of the received signal must be constant. To give you a feeling for what this means in practice, I recorded the phase progressions over approx. 40 hours in 5 sections of approx. 8 hours each with my test setup and would like to comment on them here.
The following recordings also show how the phase of the received signal changes during the night. More information on this can be found in the PTB report starting on page 355.
I don't have a recorder that can record for that long. My better oscilloscopes can only record between 500 and 1000 seconds, only the very cheap one can record 15000 seconds (> 4 hours). With some screenshots combined, I get the long time of 31000 seconds = ~8.6 hours.
My reception location is 270 km north of Mainflingen (Germany), the reception situation with a small ferrite antenna on the first floor, originally in the northern "craft room", was not good due to the many interferences. Therefore, after the first recordings, I positioned the antenna far away in a southern room, where there was - with rare exceptions - no more interference.
First a small digression: The relative uncertainty of the carrier frequency of the DCF77 frequency is given as approx. 10-12 (at 1σ, averaged over the day, PTB report, page 364). This is also referred to as 1 ppt. The following applies:
This recording begins on April, 29th, 2022 at approx. 6 a.m. and ends after just over 8 hours (31000 seconds).
Preliminary adjustment and start of recording
Before starting the recording, the system had been running for several days. At the beginning I had adjusted both OCXOs as well as possible. The result happened to be unusually good: from about 10 o'clock onwards, the phase deviation between the two OCXOs was below about 100 ns for almost 10 hours. After that, it increased, and more and more rapidly over time, i.e. the difference between the frequencies became greater and greater.
At the beginning, the fluctuations in the transit time of the DCF77 signal received during the night are still visible. There are constant phase changes for 20 minutes after 7 o'clock, but this is of course unavoidable. It is rather pleasing that there were no phase changes at all in this recording during the following 15 hours (from 7:30 to 22:30). I had never experienced that before.
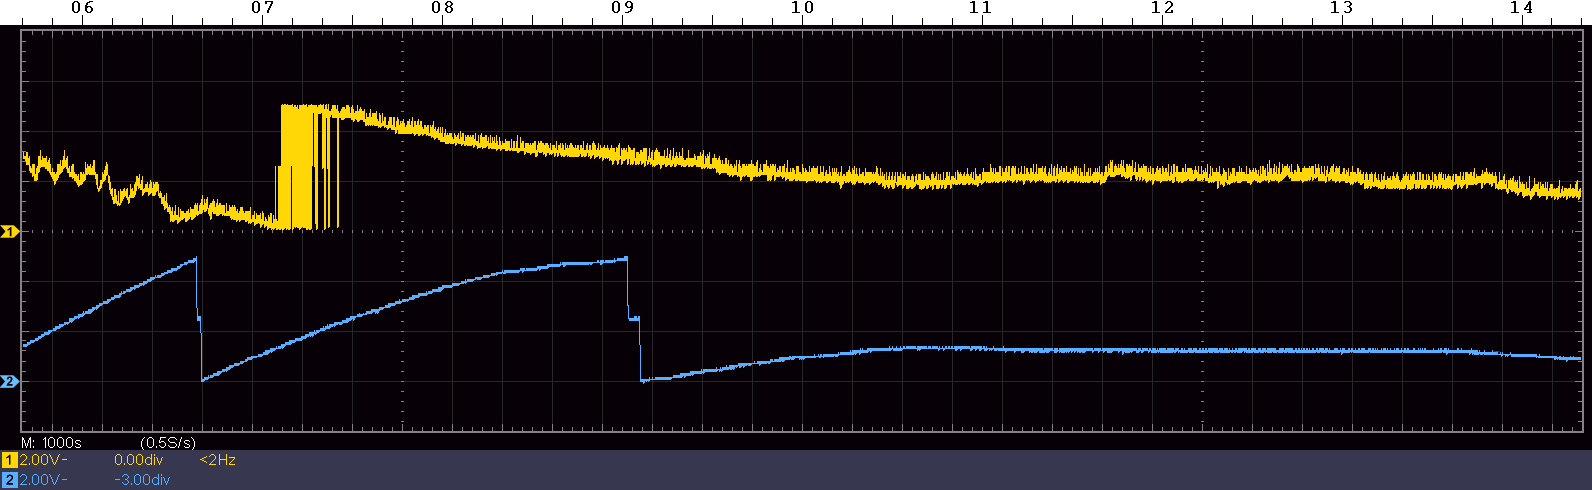
The phase deviation between DCF77 and both OCXOs only remained in the order of 100 ns from 10:30 to 13:30. I assume that the transit time of the received DCF77 signal changes significantly less during this time and therefore arrive at an average frequency deviation of the master OCXO of approx. 100 ns over approx. 3 hours:
100 ns / (4 * 3600 s) = 9.3 * 10-12 = 9.3 ppt
It may be more or less than 9.3 ppt. But the special thing here is that not only the accuracy of the OCXO frequency can be determined, but that both OCXOs even generate the 10 MHz with this accuracy. An extraordinary coincidence that I have never before been able to observe, not even approximately.
Even if you only look at the phase stability of the DCF77 signal, you can assume that the received frequency was not only relatively constant during these 3 hours, but probably also matched the transmission frequency very precisely. I also estimate the order of magnitude to be 10 ppt. In practice, it should not be possible to achieve more with a DCF77-DO, and only under special circumstances that are not encountered every day.
Another side observation is that the two OCXOs synchronize with each other when their frequencies are set very close to each other. I have observed such an exactly horizontal course of the OCXO/OCXO phase difference as here between 10:30 and 13:30 several times.
The DCF phase fluctuated only slightly until nightfall.
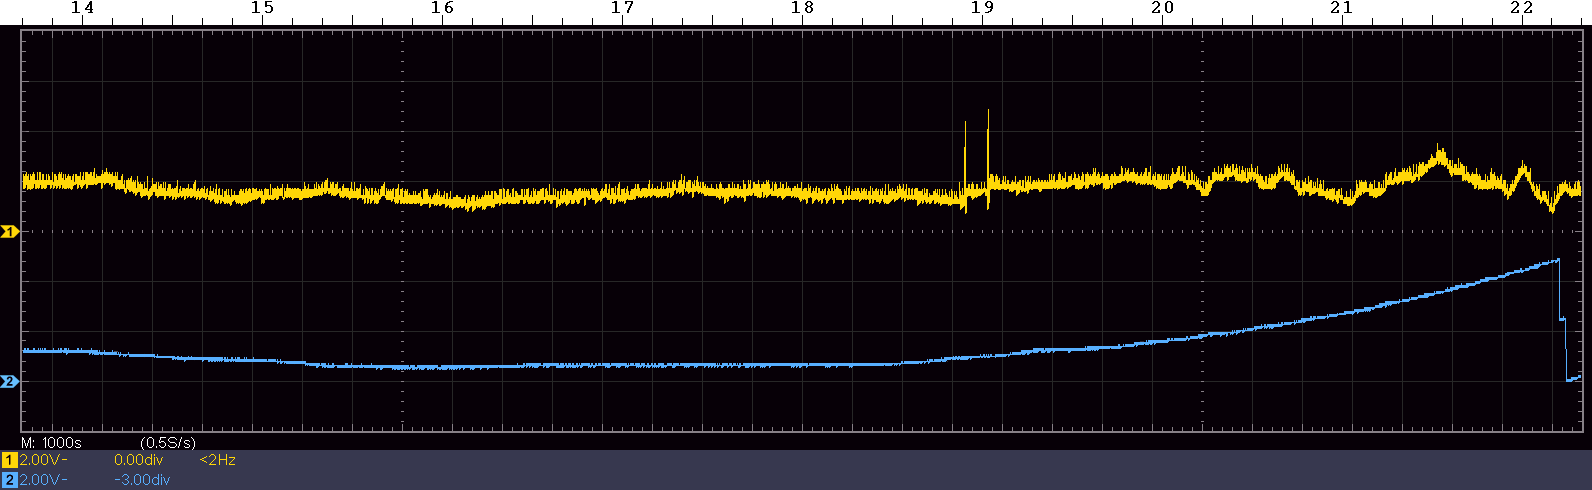
At around 7 p.m. there were two brief reception disturbances, but these only caused small phase jumps. I suspect that this was caused by our induction stove.
There are the typical phase fluctuations during the night. This is a very unfavorable time for precise frequency determination.
Example: If you were to use the DCF77 reception frequency averaged over these 10 minutes from 24:20 to 24:30 as a reference and compare it with the frequency averaged only 5 minutes later from 24:35 to 24:45, you would get results that differ by approx. 1.5*10-9. Averaged over a few hours, it could also be a factor of 10 better at night, but never as good as during the day.
At night, results can be expected that are 10 times less accurate than those that can be achieved with a relatively high degree of certainty during the day.
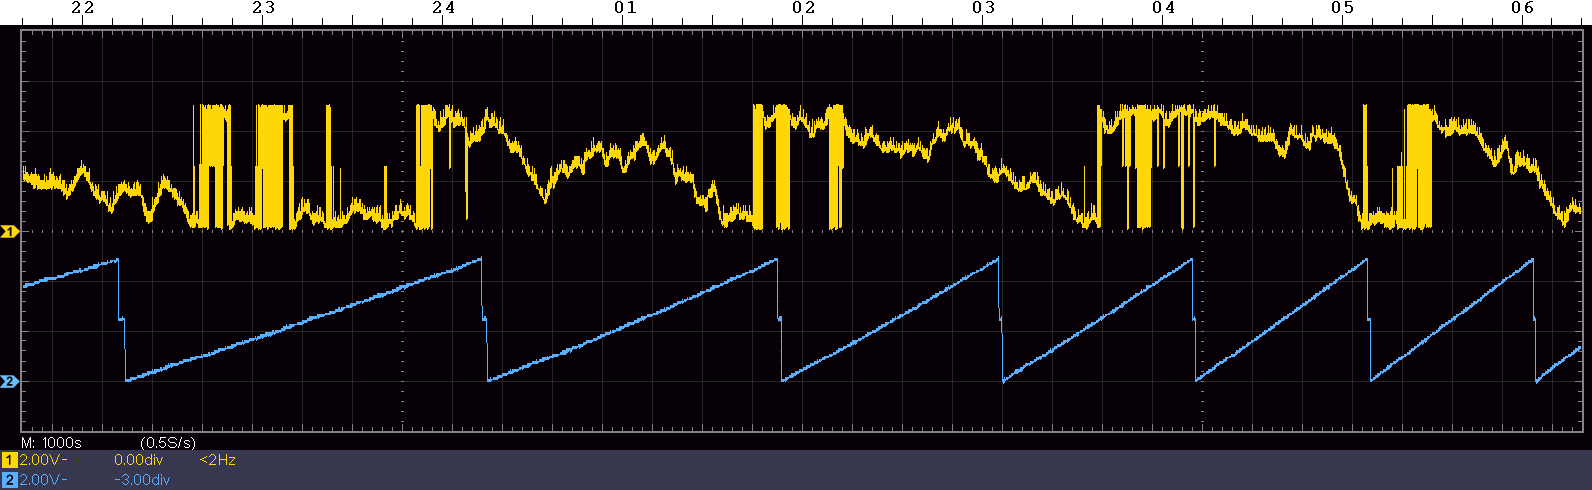
As the phase of the Monitor OCXO increases faster and faster, its frequency also increases compared to the Master OCXO. This was the case during the entire test period. The next recording shows that the monitor OCXO has the lower drift.
If you look closely, you can see that there is reception interference at around 00:08. I do not know the cause.
The phase fluctuations of the night are over shortly after 7 am. The frequencies of the monitor OCXO and master OCXO converge again.
Because the master OCXO is "between" the phase comparators, mirror-symmetrical diagrams of the phase curves would mean that the frequencies of the monitor OCXO and DCF77 are identical and only those of the master OCXO differ. This means that the frequency of the monitor OCXO is closer to the DCF77 frequency than that of the master OCXO.
The phase fluctuations, especially the maximum shortly before 1 p.m., are somewhat stronger than on the previous day.
There are no further surprises.
The frequency of the monitor OCXO is now even closer to that of DCF77, but it is nowhere near as perfect as the day before.
If the DCF77 reception frequency averaged over e.g. one hour were used as a reference on this day, the following difference would be obtained in the period 15:40 to 16:40 compared to the period 17:00 to 18:00:
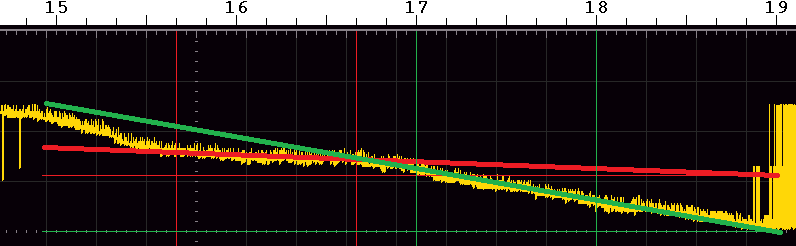
The averaged phase difference to the master OCXO is (all only roughly calculated):
The difference is therefore:
Approx. 100 ppt is considerably worse than the 1 ppt that DCF77 could theoretically deliver. On the other hand, 100 ppt, written as ±50 ppt, is 1*106 (one million) times more accurate than a commercially available, inexpensive quartz oscillator with ±50 ppm accuracy. That's quite a lot!
Here is a summary of the values determined. Most of these figures are of course not exact, especially as it can be expected that they will also depend considerably on the receiving location. But they give a good overview of the enormous differences between different sources and the effort required to determine frequencies based on DCF77.
Deviation |
ppm (10-6) |
ppb (10-9) |
ppt (10-12) |
Specification or measurement situation | ||||
1*10-12 |
1 ppt |
Basic accuracy DCF77 according to PTB data | ||||||
10*10-12 |
10 ppt |
Approximately the best possible accuracy of frequency determination via DCF77, only rarely possible |
||||||
0,08*10-9 |
0.08 ppb |
80 ppt |
Differences if measurements are taken on non-optimal days at different times over several hours | |||||
220*10-12 |
0,22 ppb |
220 ppt |
Fluctuation of the received DCF77 signal observed during 600 s during the day | |||||
1,5*10-9 |
1.5 ppb |
1500 ppt |
Typical frequency deviation of the received DCF77 signal lasting many minutes at night | |||||
1*10-8 |
0,01 ppm |
10 ppb |
Resolution 0.1 Hz or quantization error HM8021-3 at 10 MHz and 10 seconds measuring time |
|||||
70*10-9 |
0,07 ppm |
70 ppb |
Short-term fluctuation (~10 s and more) of my simple DCF77-DO |
|||||
50*10-6 |
50 ppm |
Specified nominal value deviation of a commercially available, inexpensive quartz oscillator |
By the way: After the later modification of my simple DCF77-DO with a considerably increased control time constant, it does not deliver much, but somewhat lower frequency fluctuations of an estimated 0.05 ppm, i.e. approx. 1000 times more accurate than an inexpensive quartz oscillator(!)
A comparison with a GPS-DO would be interesting. Unfortunately, I don't have one, don't need one, and therefore don't intend to buy one just for this chapter in this article.
However, I do have a friend who was able to lend me one (thanks Carsten!). But it didn't work properly (the GPS-DO, not Carsten's!). At irregular intervals, it changed its output frequency randomly in a range of roughly ±10 ppb, both continuously and often switching seamlessly. A great pity.
It is possible to determine the frequency of an oscillator, for example, very precisely using sophisticated means and in particular by observing the quality of the received signal. It certainly takes even more effort to synchronize or discipline it. However, this requires a long-term stability that goes far beyond what can be expected from an OCXO. I assume that a rubidium oscillator would be sufficient for this.
But at best, a DCF77-DO realized in this way would only provide a high-precision reference frequency in the range of ±10 ppt after a period of time that could last several days. That's what I achieved by chance with approx. ±9 ppt. However, I think this is normally only reproducible with an effort that is out of proportion to the result and no longer makes sense in practice. However, at least I have ideas about a procedure for this.
On the other hand, even if much less effort is made, a frequency accuracy can be achieved that is far, far higher than that of a normal crystal oscillator and also the long-term stability of an OCXO.
| Last update: June 2nd, 2022 | Questions? Suggestions? Mail Me! | Uwe Beis |
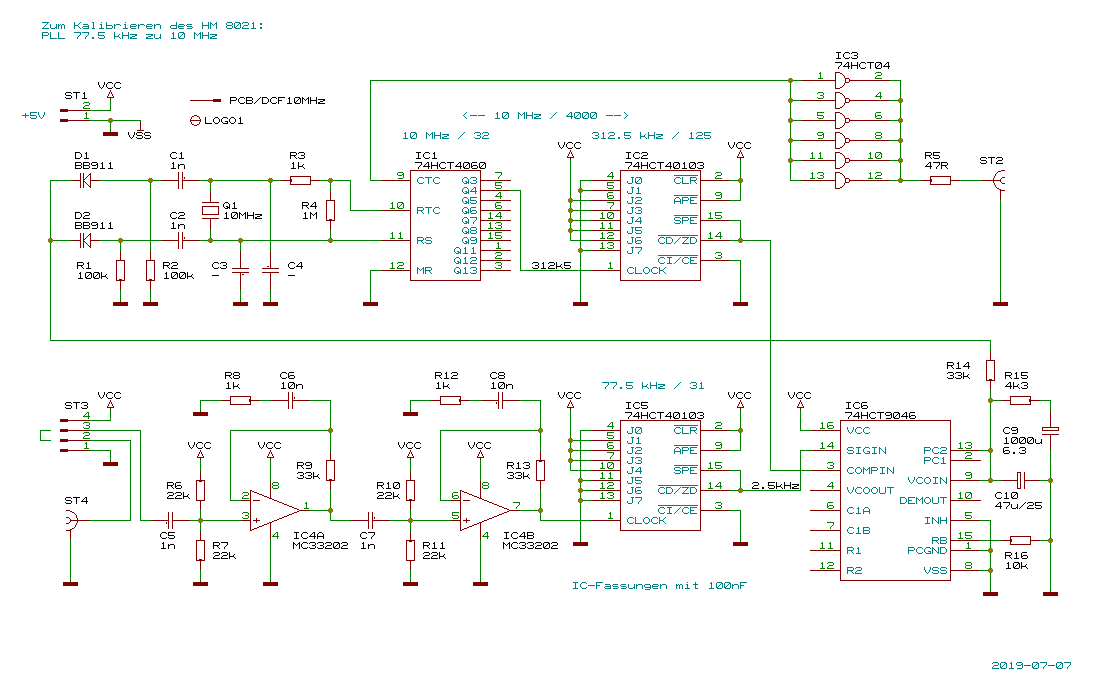 The 10 MHz-PLL